
Two tankers were hit by missiles in the Strait of Hormuz this month. Iran’s shipping route was blockaded, unblockaded, then threatened again. Oil has jumped more than 10% since 12 July. Gold, the metal behind Australia’s biggest ASX gold ETF and the asset every textbook says should love exactly this kind of headline, fell on the day the strikes landed. It is down almost 10% for the year.
Market Context
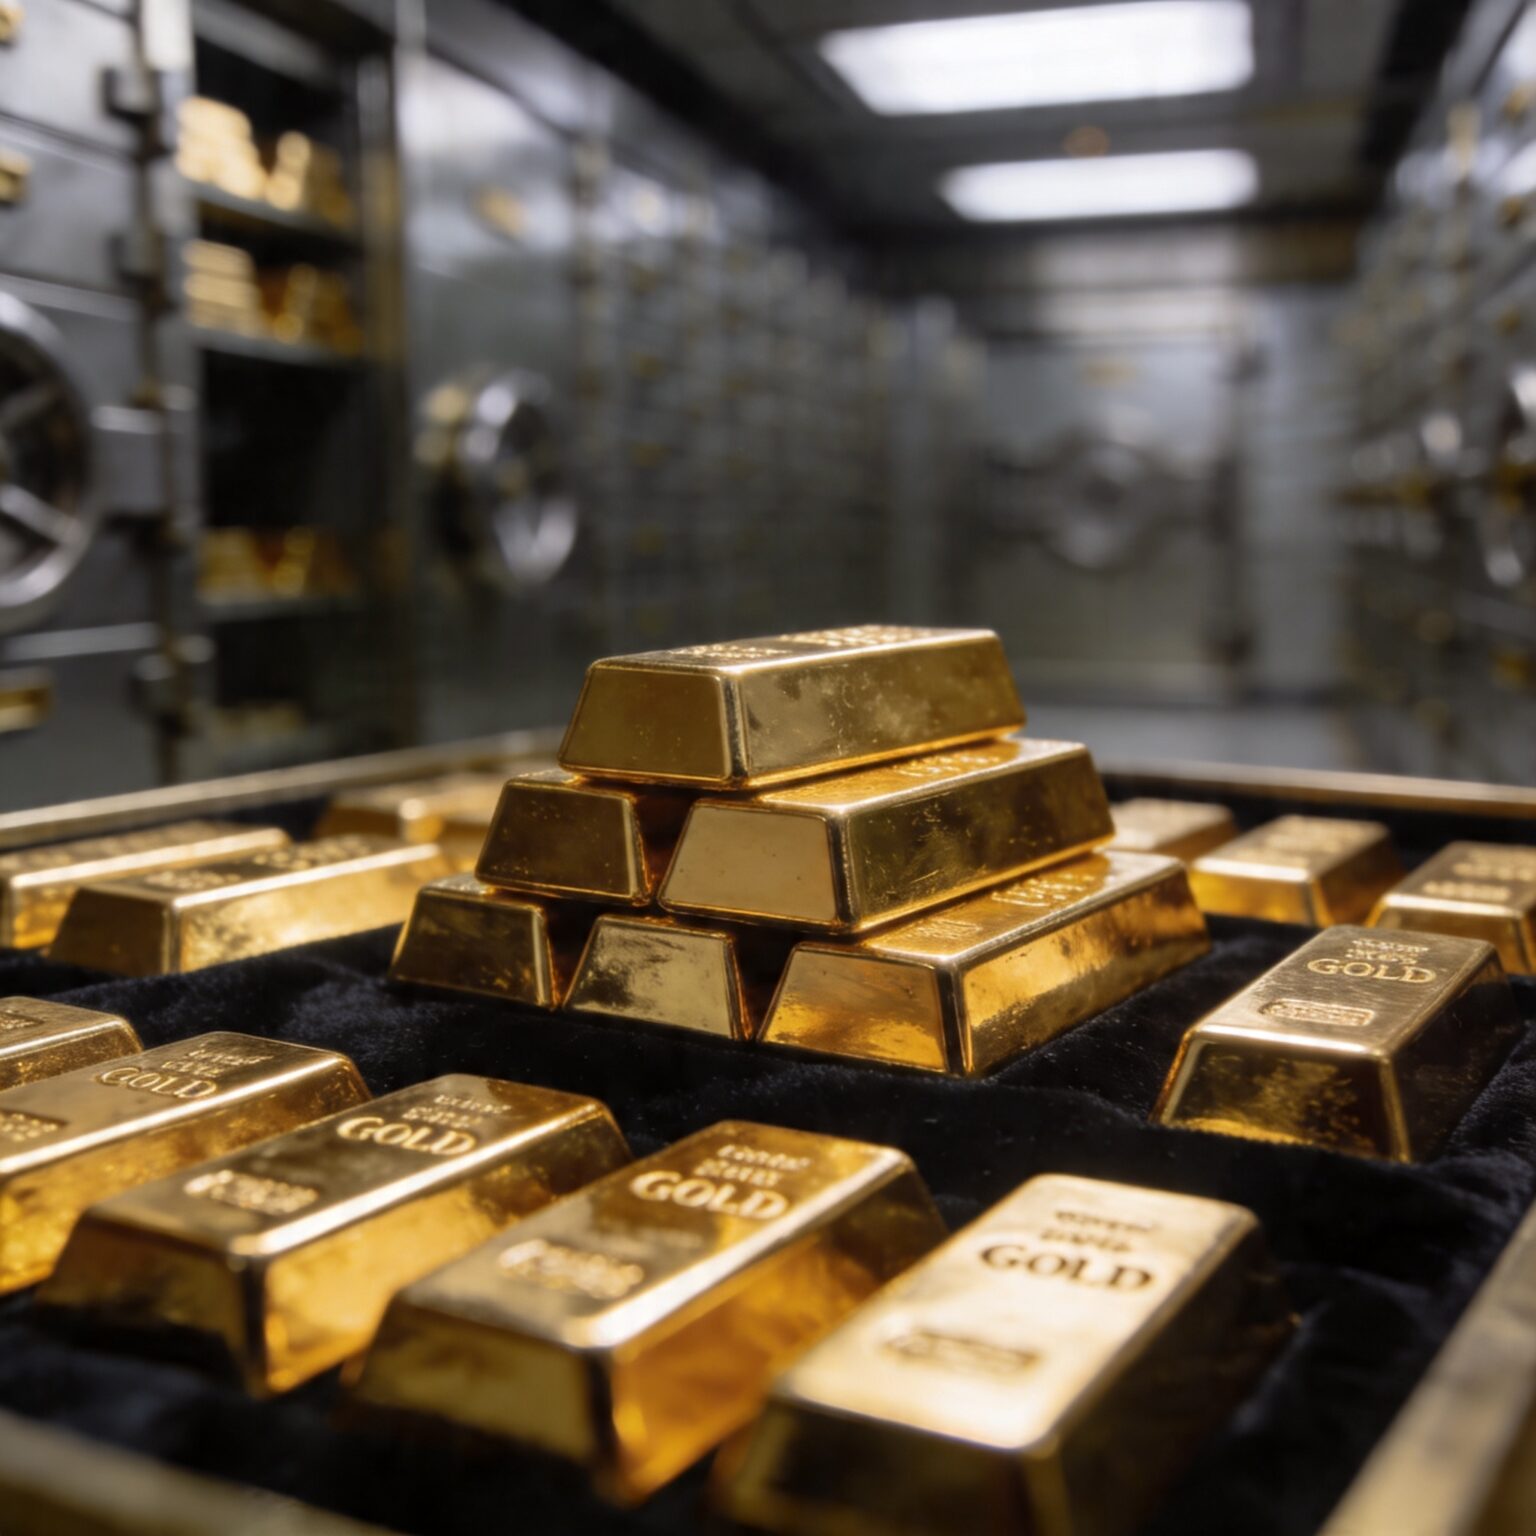
The Global X Physical Gold Structured ETF, ticker GOLD, is Australia’s largest and most liquid ASX gold ETF, with A$5.52 billion in net assets as at 13 July 2026. It has run since March 2003, tracks the spot gold price in Australian dollars before fees, holds no equities and pays no distribution, and charges 0.40% a year. Each unit represents a beneficial interest in allocated physical bullion held by JPMorgan Chase in London vaults.
2026 has been a wild year for the metal it tracks. Spot gold touched an intraday high near US$5,555 an ounce on 26 January, a run fund managers pinned on eroding trust in US monetary policy, fiscal discipline and political stability. Then it unwound hard. A stronger-than-expected May jobs report crushed rate-cut hopes and gold gave back the year’s entire gain in one session on 5 June, sliding toward US$4,339. It kept falling, touching US$4,007.69 by 30 June, its worst quarter since 2013. By mid-July it was trading in a US$4,000 to US$4,100 range, still down roughly a quarter from January’s peak (World Gold Council mid-year outlook; CBS News, Jun 2026; Global X factsheet, 13 Jul 2026).
The thesis
That is not a small distinction. If gold is a real-yield trade dressed up as a war hedge, the investor holding GOLD for protection against the next Hormuz headline is holding the wrong instrument for the risk they are trying to cover.
What the market may be missing about the ASX gold ETF
The mechanism is mundane once you see it, and it has played out in real time this month. When Iran’s tankers were hit and Hormuz traffic seized up in mid-July, oil spiked. Higher oil feeds straight into headline inflation. Higher inflation expectations argue for the Federal Reserve staying restrictive for longer. Higher-for-longer policy means higher real yields, the inflation-adjusted return available from holding cash or bonds instead of a zero-yield metal. On 13 July, with fresh US strikes on Iran the lead story of the day, spot gold fell 1.4% to around US$4,060, the opposite of the textbook safe-haven bid. The geopolitical shock acted as an inflation catalyst, not a flight-to-safety trigger, and the market priced it that way.
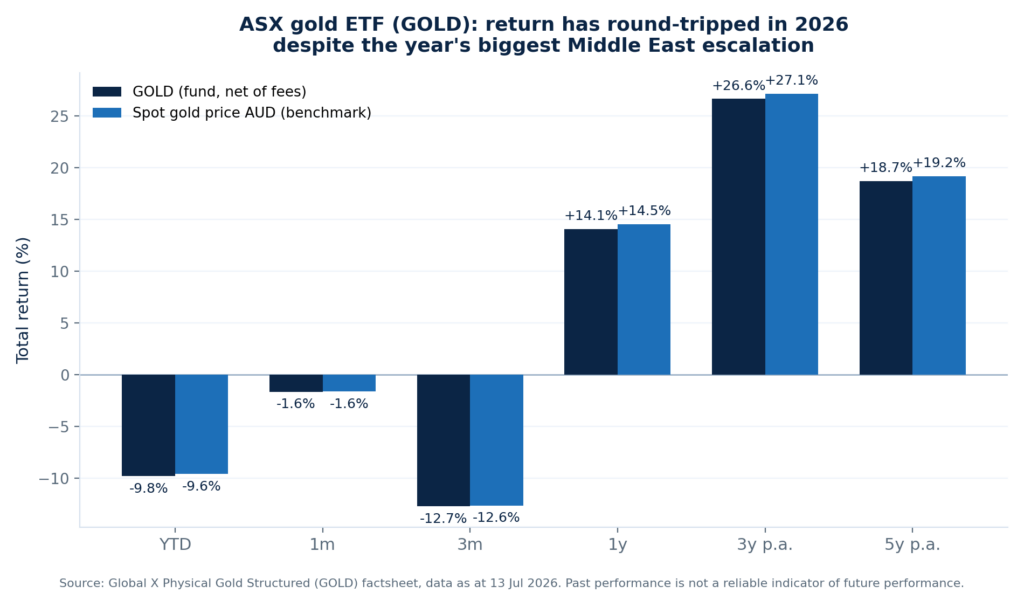
This ASX gold ETF makes the opportunity cost sharper than it looks on a chart. GOLD pays no distribution at all. Every dollar of return has to come from the price. With the US 10-year yield near 4.6% and the Australian 10-year above 4.8% in mid-July, a saver holding cash or short bonds is being paid handsomely to wait. A holder of GOLD is paid nothing, and for the past three months has watched the price fall 12.72% on top of that. The fund’s own 1-year return, +14.07%, looks respectable in isolation. It obscures a round trip: a spike to a record high, a crash of more than 25%, and a partial recovery, inside a single calendar year.
There is a second, quieter cost. GOLD is unhedged, so the return an Australian investor actually receives depends on the AUD/USD rate as well as the US dollar gold price. The Australian dollar firmed to 0.6977 on 14 July, up 0.84% on the day, on broad US dollar weakness around the June inflation print. A firming AUD mechanically shaves the local-currency gold price even when the US dollar price is flat, a currency drag most buyers of a “gold” ETF are not pricing in when they click buy.
The numbers
| Metric (as at 13 Jul 2026) | GOLD | Why it matters |
|---|---|---|
| Net assets | A$5.52bn | Largest, most liquid ASX gold ETF |
| Management fee | 0.40% p.a. | Global X’s own GXLD charges 0.15% |
| Distribution | None | Zero income, full opportunity cost |
| YTD total return | -9.79% | Despite the year’s escalation |
| 3-month total return | -12.72% | Worst stretch since the June crash |
| 1-year total return | +14.07% | Hides the round trip inside the year |
| Spot gold, intraday high | ~US$5,555/oz (26 Jan) | The peak of the 2026 spike |
| Spot gold, mid-Jul range | US$4,000–4,100/oz | ~25% below January’s high |
Catalysts & Risks
New Fed chair Kevin Warsh’s Senate testimony and US inflation data through late July will shape the real-yield direction.
The RBA’s 11 August decision matters for the AUD side of the return, while further Hormuz headlines will test whether gold keeps ignoring geopolitical risk.
A genuine Fed pivot toward rate cuts would lower real yields, historically gold’s strongest tailwind.
Continued central bank buying, especially from China and Poland, provides a demand floor separate from Western retail flows and may cushion further falls even if the real-yield story remains negative.
The zero-yield structure works against holders while real yields stay elevated, as there is no income to offset a falling gold price.
Unhedged AUD exposure adds another source of volatility. Central bank buying is the clearest risk to a bearish view, as it could put a floor under gold even while the real-yield mechanism argues for downside.
GOLD’s legal structure, a redeemable preference share with an entitlement to metal rather than a plain unit trust, is worth checking in the PDS before assuming redemption mechanics work like a standard ETF.
The view would change if gold rallied on fresh escalation headlines while real yields held or rose. That would suggest crisis-hedging demand has returned.
Investor Takeaway
Gold has not stopped being useful in a portfolio. It has stopped being the crisis-headline trade the marketing suggests. Anyone holding this ASX gold ETF expecting it to spike on the next Middle East flare-up has been wrong for six months running, most recently on 13 July, when fresh strikes on Iran coincided with a falling price. The stronger case for GOLD is as a hedge against a loss of faith in the Fed or the US fiscal position, the story behind January’s spike, not as insurance against a specific war. Size it for that risk, watch real yields rather than headlines, and treat the zero income as a real cost, not a footnote. For more fund analysis, see our ETFs and funds coverage.