
Few indicators in finance have earned a reputation as powerful as the yield curve.
For over half a century, an inverted Treasury yield curve has preceded every American recession. It appeared before the recessions of the 1970s, the downturn of the early 1980s, the 1990 recession, the dot-com crash, the GFC and the COVID recession.
Its track record has made it one of the most closely watched indicators in financial markets. When the yield curve inverts, economists, investors, banks, the government and policymakers pay attention.
But the yield curve does not predict recessions because of voodoo magic. It works because it reflects something simple: when bond investors believe economic growth will weaken, they expect central banks to cut rates. Those expectations appear in the bond market long before they appear in official economic data.
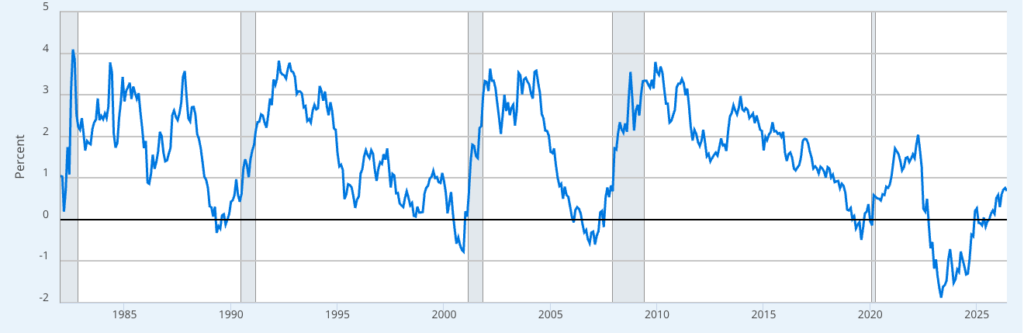
10-Year Treasury Constant Maturity Minus 3-Month Treasury Constant Maturity. Shaded areas indicate U.S recessions. Source: Federal Reserve Bank of St. Louis via FRED
What Is The Yield Curve?
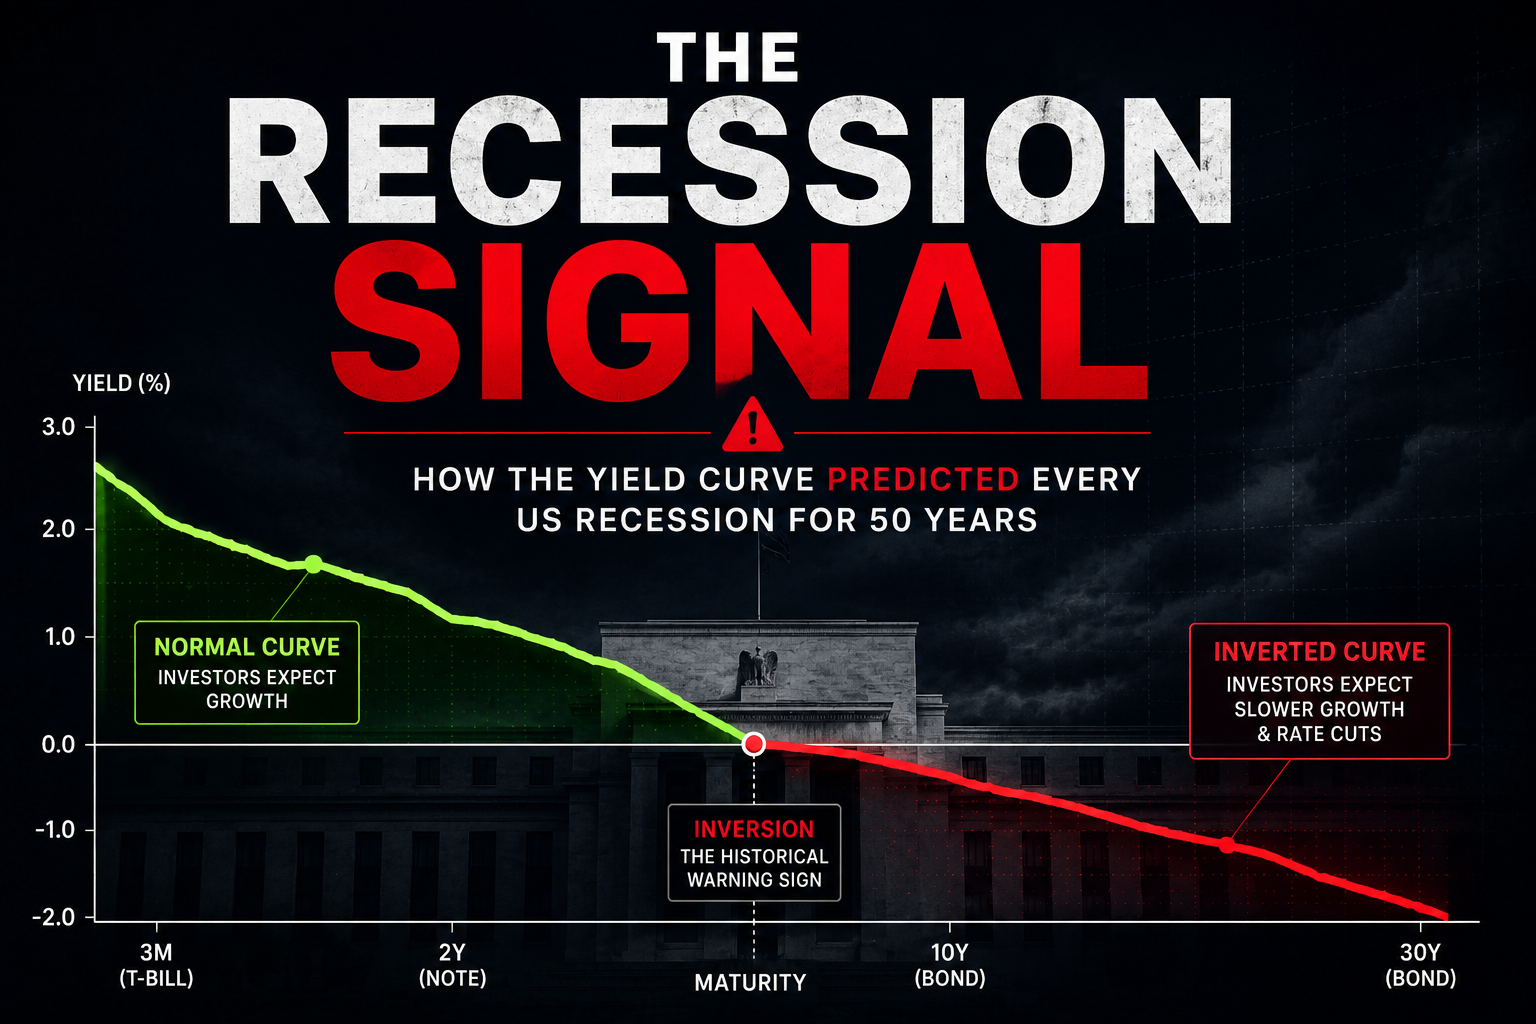
The yield curve is simply a graph showing the relationship between short-term and long-term government bond yields.
Under normal circumstances, investors demand higher interest rates for lending money over longer periods of time. As a result, long-term Treasury bonds typically yield more than short-term Treasury bills.
This creates an upward-sloping yield curve.
The logic is straightforward. Lending money for ten years involves greater uncertainty than lending it for three months. Investors therefore require additional compensation for taking on that extra risk.
What Is A Yield Curve Inversion?
Sometimes this normal relationship breaks down.
As short-term interest rates rise and long-term rates fall, the gap between the two narrows. This is known as a flattening yield curve.
When long-term rates eventually fall below short-term rates, the curve becomes inverted.
An inverted yield curve means investors are willing to accept a lower interest rate for lending money over ten years than they would receive for lending it over a much shorter period. On the surface, this appears irrational and violates the normal logic of lending.
If someone offered to borrow your money for ten years rather than three months, you would normally demand a higher interest rate as compensation for the additional risk, inflation, changes in rates and uncertainty. An inverted yield curve suggests investors are willing to do the opposite.
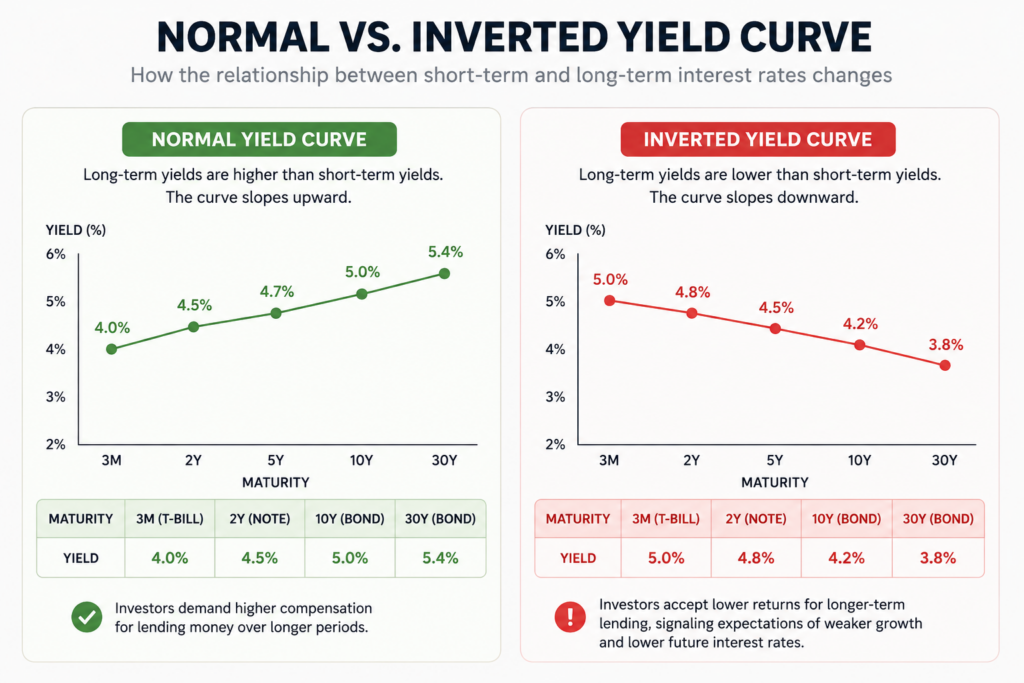
In reality, it reflects expectations that economic growth and interest rates will be lower in the future than they are today.
Why Does It Predict Recessions?
The yield curve’s predictive power comes from the relationship between interest rates, economic growth and monetary policy.
When inflation is high, the Fed often raises short-term interest rates in an effort to slow demand. Because short-term Treasury yields closely follow the Federal Funds Rate, these yields typically rise as the Fed tightens monetary policy.
However, investors are constantly looking ahead.
If bond markets believe higher interest rates will eventually slow economic growth, they may begin purchasing longer-term government bonds in anticipation of future rate cuts. This increased demand pushes long-term bond prices higher and thus yields lower as short-term yields continue rising.
Eventually, long-term yields can fall below short-term yields, causing the yield curve to invert.
In essence, an inversion reflects the bond market’s belief that current interest rates are unsustainably high and that weaker economic conditions will eventually force the Fed to reverse course. Rather than predicting recessions directly, the yield curve is signalling that investors expect a significant slowdown in economic activity which may lead to a recession.
The Yield Curve Doesn’t Predict Timing
Every Recession For 50 Years
Every US recession over the past 50 years was preceded by a yield curve inversion. From the early 1970’s downturn to the COVID recession, every single recession had the same indicator.
Few economic indicators can claim such a track record. While the timing may vary, the yield curve has repeatedly provided an early warning signal that economic conditions are beginning to deteriorate.
Arturo Estrella And The New York Fed
The yield curve’s predictive power did not gain widespread recognition until the 1980s, when economists began formally studying the relationship between bond markets and recessions.
One of the most influential figures in this research was Arturo Estrella of the Federal Reserve Bank of New York. Working with historical data, Estrella found a statistically significant relationship between yield curve inversions and future recessions.
His research was initially met with skepticism. However, after successfully signalling the 1990 recession, and later providing warnings ahead of the 2001 downturn and the GFC, the model gained significant credibility among economists and investors alike.
Why Investors Still Watch It Today
Over 30 years Estrella’s research, the yield curve remains one of the most closely monitored indicators in financial markets.
Unlike many economic statistics that describe what has already happened, the yield curve reflects the collective expectations of millions of investors about the future path of economic growth, inflation and interest rates.
This forward-looking nature is what gives the indicator its value. When the yield curve inverts, investors are effectively signalling that they expect economic conditions to weaken sufficiently to force the Federal Reserve to cut interest rates in the future.
While no indicator is perfect, the yield curve’s combination of simplicity, economic logic and historical accuracy has helped cement its reputation as one of the most respected recession indicators in finance.
The Yield Curve Doesn’t Predict Timing
Recessions Take Time To Develop
A big misconceptions surrounding yield curve inversions is that recessions occur immediately afterwards.
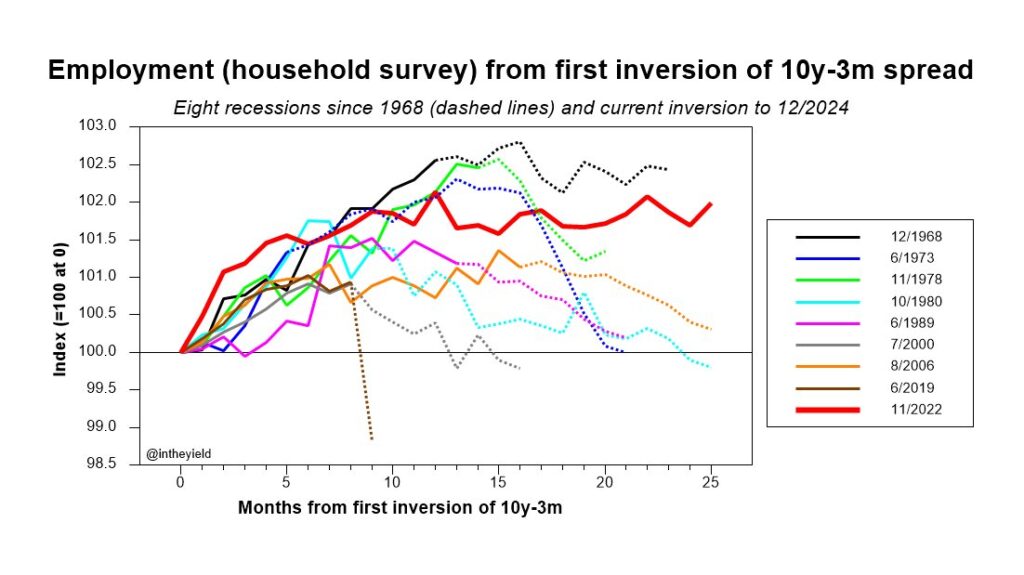
In reality, economic slowdowns often take months to develop. Businesses don’t suddenly stop hiring, consumers do not instantly reduce spending, borrowers don’t just stop borrowing and lenders lending and companies don’t immediately cut investment simply because the yield curve has inverted.
Historically, recessions have often arrived around 12 to 18 months after a sustained inversion. The yield curve therefore acts more as an early warning signal than a precise forecasting tool, indicating that recession risks are rising rather than predicting an exact date.
Not All Inversions Are Equal
Investors also distinguish between brief inversions and sustained inversions.
A yield curve may invert for a few days or weeks due to short-term, temporary market volatility. While these events often attract attention, economists generally place greater emphasis on inversions that persist for several months.
It is these prolonged inversions that have historically carried the strongest predictive power and have most frequently preceded economic downturns.
Every Time Is Supposed To Be Different
Whenever the yield curve inverts, a familiar debate tends to emerge.
Some argue that the signal has been distorted by central bank policies, global demand for government bonds or unusual economic conditions. Others claim that structural changes in financial markets have permanently weakened the indicator’s reliability.
Similar arguments were made before the recessions of 1990, 2001 and 2008. More recently, some analysts argued that global demand for US Treasuries, quantitative easing and international capital flows had distorted the signal following the 2019 inversion.
Yet despite these concerns, the recession ultimately arrived.
This does not guarantee that every future inversion will be followed by a recession. However, history suggests investors should be cautious about dismissing the signal simply because current circumstances appear unique.
What Is The Yield Curve Saying Today?
After spending much of 2022, 2023 and 2024 in inversion, the US Treasury yield curve has largely returned to an upward slope. The spread between 10-year and 2-year Treasury yields is once again positive, suggesting the most acute phase of the recession warning has passed.
However, investors should be careful not to assume that this automatically means recession risks have disappeared.
Historically, yield curves often re-steepen before recessions begin. As expectations shift toward future interest rate cuts, short-term yields can fall faster than long-term yields, causing the curve to normalize even as economic conditions weaken.
This is one reason economists focus on the entire sequence rather than a single moment in time. The inversion is often the first warning sign, while the subsequent steepening can simply reflect markets pricing in slower growth and eventual policy easing.
Today, the New York Fed’s recession model suggests recession risks are substantially lower than they were during the inversion period, reflecting a stronger labour market and more resilient economic growth than many investors expected.
The Bond Market’s Crystal Ball
No economic indicator is perfect.
The yield curve can’t tell investors exactly when a recession will occur, how severe it will be or what will actually trigger it. Yet few indicators have matched its combination of economic logic, simplicity and historical accuracy.
For more than half a century, the bond market has repeatedly identified risks long before they became visible in economic and market data. Whether it continues to maintain that remarkable track record remains to be seen.
But history suggests that when the yield curve starts flashing warning signs, investors should pay attention.