
Catalyst Metals fell 17% in a single session in May after warning that costs at its Plutonic gold mine were running well ahead of plan. In July it rose 12% in a session after reporting the best quarterly gold output from that same mine since 2013. Both moves treated the news of the day as the whole story. Neither was.
Market context
The Catalyst Metals share price has had a volatile 2026, and the two moves sit at opposite ends of it. On 2 May, the West Australian gold miner released its March-quarter update alongside a lift to FY26 all-in sustaining cost (AISC) guidance, from A$2,200–2,650 an ounce to A$2,750–2,950 an ounce, even as it held full-year production guidance at 100,000 to 110,000 ounces. The stock fell 17% that day.
Nine weeks later, on 3 July, Catalyst reported June-quarter output of 31,812 ounces from the Plutonic Gold Belt, the highest quarterly figure since Barrick owned the belt in 2013, taking full-year Plutonic production to a record 104,000oz, within guidance. Cash and bullion rose A$46 million over the quarter to A$323 million, the company remains debt-free, and it still has an undrawn A$100 million facility. The shares jumped 11.94% to A$5.72 that morning (Kalkine, 3 July 2026) and have kept climbing since, last near A$6.09 (7 July 2026), implying a market capitalisation of roughly A$1.59 billion on 260.95 million shares on issue.
The thesis
Treat them as one continuous story and the picture changes. Gold traded above US$5,500 an ounce intraday in January 2026, then fell almost 15% in the June quarter alone to close at US$4,007.69 on 30 June, its worst quarter since 2013. It has since recovered to around US$4,150–4,166 in early July. At an AUD/USD rate near 0.693 (US Federal Reserve H.10 data, 8 July 2026), that puts spot gold at roughly A$5,990 an ounce, a figure that dwarfs the cost increase that spooked the market in May.
What the Catalyst Metals share price move is missing
The most important number in the May announcement was never the new AISC guidance on its own. It was the gap between that guidance and the gold price it would be measured against. At the top of the revised range, A$2,950 an ounce, Catalyst’s margin at a A$5,990 gold price is still around A$3,040 an ounce, comfortably above the roughly A$2,300 an ounce AISC the Plutonic operation was running at as of August 2025 (Catalyst Metals FY25 results, 29 August 2025), when the gold price averaged far less than it does now. The cost increase is real. It has simply been outrun.
There is a second thing a headline read of the production numbers misses. Catalyst’s FY25 group total of 108,018 ounces looks larger than FY26’s 104,000 ounces, which on its face reads like a decline. It isn’t. The FY25 figure included 21,634 ounces from the Henty gold mine in Tasmania, sold in May 2025. Strip Henty out and Plutonic-only production rose from 86,384 ounces in FY25 to 104,000 ounces in FY26, up 20%, a genuine record for the asset rather than a like-for-like retreat dressed up as one.
The third piece is the balance sheet. Catalyst is simultaneously developing three new mines, Trident underground, Old Highway and Cinnamon, to lift Plutonic’s output toward 200,000 ounces a year, and it grew cash and bullion by A$85 million in the six months to 30 June while doing it, without touching its A$100 million facility. That said, Catalyst is not the cheapest producer in its peer set: global mid-tier gold miners’ average AISC ran near US$1,844 an ounce in the March quarter, against Catalyst’s FY26 guidance, which converts to roughly US$1,905–2,040 an ounce at current exchange rates. What it is doing, almost alone among growing gold miners this year, is funding a near-doubling of output entirely from its own operating cash flow.
The numbers
| Metric | Value | Why it matters |
|---|---|---|
| Share price reaction | -17% (2 May 2026); then +11.9% to A$5.72 (3 Jul 2026) | Market priced the cost shock and the production beat as separate events |
| FY26 Plutonic production | 104,000oz record; guidance 100,000–110,000oz | +20% versus FY25 Plutonic-only 86,384oz, once Henty is excluded |
| FY26 AISC guidance | A$2,750–2,950/oz, raised from A$2,200–2,650/oz (2 May 2026) | About 24% above the ~A$2,300/oz Plutonic was running at in Aug 2025 |
| Implied gold price | ~A$5,990/oz (computed, 7 Jul 2026) | Margin still about A$3,000+/oz even after the cost guidance hike |
| Cash, bullion and liquidity | A$323m cash and bullion (30 Jun 2026); debt-free, A$423m total liquidity | Self-funding three concurrent mine developments |
| Market cap / enterprise value | ~A$1.59bn market cap / ~A$1.27bn EV (7 Jul 2026) | Enterprise value nets off the net cash position |
| EV per resource / reserve oz | ~A$282/oz (4.5Moz resource) / ~A$847/oz (1.5Moz reserve) | Sanity check pending full FY26 financial detail |
| FY25 EBITDA margin | 42.6% (EBITDA A$193.1m / revenue A$453.1m) | Baseline profitability before the FY26 cost step-up |
Sources: Catalyst Metals ASX announcements, FY25 results and June-quarter update; Kalkine, Simply Wall St, CNBC, StockAnalysis.com, Market Index and AUD/USD data via US Federal Reserve H.10. Implied gold price and EV/oz figures are The Investor Standard calculations from cited inputs, not reported company figures.
Valuation
Catalyst has not yet reported the financial detail, revenue, EBITDA, NPAT, behind the June quarter; that level of granularity is due in the full FY26 result, expected around August, following last year’s 29 August release date. What is verifiable now is enough for a lighter sanity check rather than a full earnings model. Net of its A$323 million cash and bullion position and zero debt, enterprise value is roughly A$1.27 billion. Against a 4.5 million ounce mineral resource (up from 3.5Moz a year earlier) and a 1.5 million ounce ore reserve (up from 0.9Moz), that implies an EV of about A$282 an ounce of resource and A$847 an ounce of reserve.
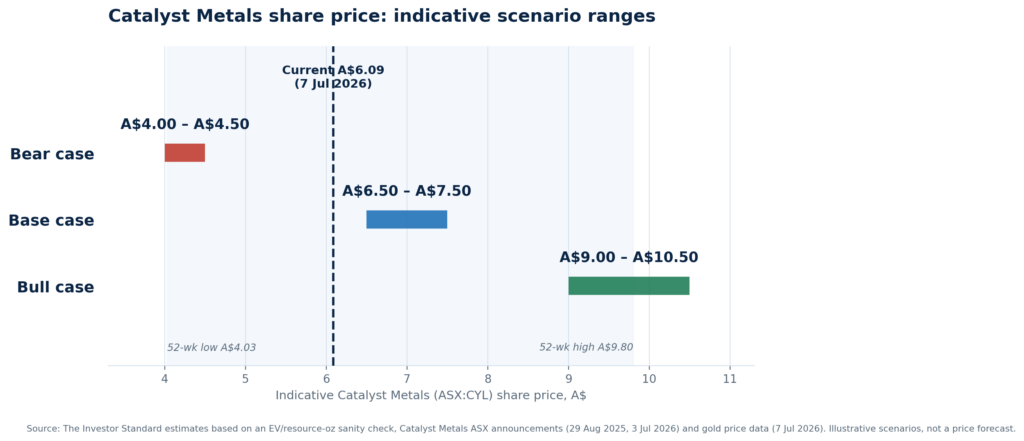
The scenarios below use that EV/resource-ounce framework rather than a discounted cash flow, reflecting that Catalyst’s FY26 profit and loss detail is not yet public. They are Investor Standard estimates built on stated assumptions, not price targets, and should be read alongside the wide dispersion in analyst price targets on this stock: different data providers show 12-month consensus targets ranging from below A$10 to above A$15, which points to thin or inconsistent broker coverage rather than a settled view.
| Scenario | Key assumptions | Indicative value |
|---|---|---|
| Bear | Gold retraces toward A$5,000–5,200/oz; AISC tests the top of guidance or higher as K2 ramps; growth pipeline slips. | ~A$4.00–4.50 |
| Base | AISC holds within A$2,750–2,950/oz; gold stays broadly steady near A$5,700–6,000/oz; Trident, Old Highway and K2 progress on schedule. | ~A$6.50–7.50 |
| Bull | Production path to 200,000oz is confirmed; reserves grow toward 2Moz; gold resumes its uptrend toward prior highs. | ~A$9.00–10.50 |
Indicative values are The Investor Standard estimates based on an EV/resource-ounce sanity check and stated assumptions. They are scenario illustrations, not precise targets or advice.
Catalysts & Risks
The FY26 result, expected in August, will show whether the new AISC guidance held for the full year and how much of the cash build survives the growth capital program.
K2’s transition from development to production is only one quarter old, making the next quarterly update the key watch point. Investors should also watch whether the higher-than-forecast recoveries flagged at K2 and the Trident open pit are confirmed.
Approvals and first ore at Trident underground, Old Highway and Cinnamon over the next one to two years are the path to the stated 200,000oz target and the roughly ten-year Plutonic mine life.
Reserves have already roughly doubled since September 2025, creating the mechanism for the EV/resource multiple to re-rate without needing gold to keep rising.
This is the second time in FY26 Catalyst has revised AISC guidance higher, and K2’s single quarter of production data is not yet a track record.
If the next quarterly update shows costs testing the top of the A$2,750–2,950 range, or if gold retraces meaningfully from early-July levels, the margin cushion that supports the thesis compresses quickly.
The stock has already moved between a 52-week low of A$4.03 and a high of A$9.80, so it can move fast in either direction. The wide spread in broker price targets is also a risk signal worth taking seriously.
Investor Takeaway
Catalyst’s May sell-off and July rally were reactions to two ends of the same trade: a cost base that stepped up in a year when the gold price moved by far more in the other direction. The market has started to reprice that, taking the shares from a 3 July print near A$5.72 to around A$6.09 inside a week, but the Catalyst Metals share price still sits well under half its 52-week high and at a resource multiple that assumes little of the growth pipeline succeeds. The next real test is the FY26 result in August, when the market finally gets the cost and margin detail behind the July headline. Until then, the case rests on production and cash data that has, so far, done what it said it would.