


Web Travel Group shares rose 11.7% to A$3.14 on Tuesday morning after the company guided to 1H27 earnings and flagged an on-market buyback of up to A$90 million. Every wire led with the buyback. The buyback is a use of cash the company already had. The line that changed the arithmetic was a currency assumption most readers skipped.
What Web Travel Group put on the table
Web Travel Group (ASX: WEB) is what remains after the consumer-facing Webjet business was demerged in September 2024. The whole company is now WebBeds, a business-to-business hotel distribution platform that contracts accommodation inventory and sells it to travel agents, tour operators and online travel businesses. It reports in Australian dollars. It earns in euros.
Tuesday’s update covers the six months to 30 September 2026, which the company calls 1H27. Three numbers matter. WebBeds expects a TTV margin of about 6.7%, up from 6.5% in the corresponding half. WebBeds revenue in its euro functional currency is expected to rise 11% to 15%. Group underlying EBITDA is guided to A$80 million to A$86 million, and the company says that range absorbs a currency headwind of roughly 9% against 1H26.
Alongside it, the board flagged an on-market buyback of up to A$90 million from August 2026, funded out of existing cash, with shares cancelled on purchase. The stated reason was that the board does not believe the current price reflects trading performance, cash generation and the medium-term earnings outlook. Shares remain down 32.2% over twelve months as at 28 July 2026.
The 9% nobody led with
Start with the currency, because it does the heavy lifting. The company’s guidance assumes an AUD/EUR rate of about 0.61 for 1H27 against about 0.56 for 1H26. Euro earnings translated at a stronger Australian dollar shrink. The stated rates imply a translation drag of about 8%. The company calls it roughly 9%. Either way, the reported number is being pushed down by an exchange rate, not by the business.
Run it through. WebBeds euro revenue growth of 11% to 15%, translated at that rate shift, lands as Australian dollar revenue growth of roughly 2% to 6%. In 1H26 WebBeds turned over A$204.6 million of revenue and A$94 million of EBITDA, a 45.9% margin. Across FY26 the group carried A$24.3 million of standalone corporate costs, so splitting those evenly puts 1H26 group underlying EBITDA at about A$82 million on our estimate. Against that, the A$83 million midpoint of Tuesday’s guidance is growth of under 2%.
Now remove the currency. Deflate the A$83 million midpoint by the 8.2% translation drag the company’s own rates imply and you get about A$90 million of constant-currency earnings, roughly 10% above 1H26. That is the number the business is actually producing. The Australian dollar is taking most of it away before it reaches the income statement.
This matters more this week than most weeks. Australia’s June quarter CPI lands Wednesday, with consensus near 4.1% headline and a 3.7% to 3.8% trimmed mean as at 24 July. The rates market priced roughly a 36% chance of an RBA hike on 11 August. Every additional hike that firms the Australian dollar makes WEB’s reported earnings look worse while leaving the euro-denominated business untouched. The stock is being marked on the wrong currency at the exact moment the domestic rate cycle is doing the most damage to it.
Web Travel Group shares are priced on volume, but earnings run on margin
The second thing the market has not repriced is that WebBeds changed variable.
FY26 was a volume year. TTV rose 20% to A$5.82 billion, bookings rose 18% to 9.9 million, revenue rose 20% to A$394.1 million and the TTV margin barely moved, from 6.7% to 6.8%. FY27 has opened differently. In the first eight weeks of the year bookings grew 6% and TTV grew 4% in constant currency. That is a genuine deceleration, and it is the number bears point to.
It is also the wrong number to watch. TTV is gross booking value. WebBeds keeps 6.8 cents of every dollar of it. Move that take rate 20 basis points and you move more revenue than a whole percentage point of volume growth does.
The chart below quantifies it. Holding TTV growth at 4% and flexing the margin across the 6.5% to 7.1% band the company has actually operated in over the last two years produces a A$36 million swing in group EBITDA. Holding the margin at the guided 6.7% and flexing TTV growth from 2% to 8% produces a A$24 million swing. Sixty basis points of margin outweighs six percentage points of volume.
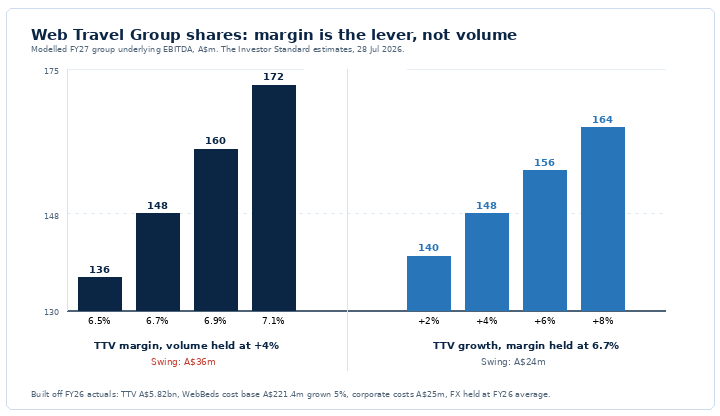
Two things about that model are worth stating plainly. It holds the exchange rate at the FY26 average, so it is an operating sensitivity and not a forecast. And it is built from FY26 actuals rather than guidance: WebBeds turned A$394.1 million of revenue into A$172.7 million of EBITDA, implying a cost base of A$221.4 million, which we grow 5%. Run the guided combination through it, 4% TTV growth at a 6.7% margin, and it produces A$148 million of group EBITDA. Annualising the guidance range using FY26’s half-year weighting produces about A$151 million. Two different routes, 2% apart. The model holds.
The numbers, and the problem with the cash
Here is where most bull cases on this stock go wrong. WEB ended FY26 with A$448.1 million of cash and redeemed A$250 million of convertible notes on 12 April 2026, leaving pro forma cash of about A$398.1 million plus an undrawn A$100 million revolving facility. Against a market capitalisation near A$1.08 billion, subtracting all of that cash gives an enterprise value of A$685 million and an EV/EBITDA multiple of 4.6 times. That looks like a mistake by the market.
It probably is not. WebBeds is a bed bank. It collects from travel agents and pays hotels on a lag, so a material portion of the cash on its balance sheet is supplier float, not shareholder money. The company does not disclose the split, and we will not guess at one. So we run the enterprise value three ways and let the reader see the spread.
| Cash treatment | Net cash credit |
Enterprise value |
EV / FY26A EBITDA |
EV / FY27E EBITDA |
|---|---|---|---|---|
| Full credit (all cash is shareholder cash) | A$398m | A$685m | 4.6x | 4.5x |
| Half credit (base case) | A$199m | A$884m | 6.0x | 5.9x |
| No credit (all cash is supplier float) | nil | A$1,083m | 7.3x | 7.2x |
Market capitalisation of A$1,083m at A$3.14 on 28 July 2026, intraday, on approximately 345 million shares, derived from the market capitalisation and price pair published by StockAnalysis as at 21 May 2026. FY26 actual group underlying EBITDA A$148.4m, year to 31 March 2026. FY27E group underlying EBITDA A$151m, The Investor Standard estimate.
Even on the harshest treatment, where every dollar of cash is assumed to belong to a hotel, WEB trades on about 7.2 times forward EBITDA. For a platform running a 43.8% EBITDA margin, 107% cash conversion and low capital intensity, that is not expensive. On the middle treatment it is 5.9 times. The range is the honest answer, and the range is cheap.
Base, bull and bear
The A$90 million buyback retires stock as it goes. At an average price near A$3.40 it removes roughly 26.5 million shares, taking the count to about 318.5 million, and takes cash to about A$308 million. All three cases below are struck after that.
| Case | FY27E EBITDA | EV/EBITDA | Cash credit | Implied value | vs A$3.14 |
|---|---|---|---|---|---|
| Bear (25%) | A$140m | 5.0x | nil | A$2.20 | -30% |
| Base (50%) | A$151m | 7.0x | A$154m | A$3.80 | +21% |
| Bull (25%) | A$156m | 9.0x | A$308m | A$5.38 | +71% |
Probability-weighted value A$3.80. Bear assumes 1H27 lands at the A$80m floor, the TTV margin drifts back to the 6.5% FY27 minimum in the second half, and the Spanish tax audit resolves against the company. Base takes the A$83m guidance midpoint annualised on FY26’s half-year weighting. Bull takes the A$86m top of guidance, margin gains holding, and the currency headwind easing as 2H27 laps a weaker comparative. All figures are The Investor Standard estimates, 28 July 2026.
We have not published a peer multiple table. Same-day verified EV/EBITDA data for the ASX travel comparables was not obtainable at the time of writing, and a table of multiples struck on stale prices would flatter or damn the stock by accident. The internal anchors are real enough: WEB traded as high as A$5.49 inside the last twelve months, and fell 36% in a single session on 6 February 2026 when the Spanish tax audit surfaced.
Catalysts
Wednesday’s CPI print and the RBA’s 11 August decision are the near-term drivers, and they work through the currency rather than through demand. A softer trimmed mean that takes the August hike off the table eases the Australian dollar and hands WEB back part of the 9% translation drag it is currently guiding around. A hot print does the reverse. The buyback is expected to start in August. The AGM on 27 August carries a further trading update and the special resolution to rename the company WebBeds Group Limited, which needs 75% support.
The real test is the 1H27 result in November. That is where the 6.7% margin either shows up as the third consecutive half of expansion or does not.
Risks, and they are not small
The Spanish tax audit is unquantified and unresolved. It cost shareholders 36% in a day in February and nothing has been disclosed since to bound the exposure. That is an unhedgeable risk sitting on top of an otherwise clean balance sheet, and it is the single largest reason this piece is rated Accumulate rather than Buy.
Volume growth has stalled. Four per cent constant-currency TTV growth in the opening eight weeks against 20% in FY26 is a real change, and the margin thesis only works while margin keeps expanding. Management’s own FY27 floor of at least 6.5% sits below the 6.8% delivered in FY26, which tells you the company is not promising the trend continues.
Guidance credibility is thin. In October 2024 the company cut its first-half TTV margin expectation from about 7% to about 6.4% and its EBITDA margin outlook from 52% to about 44%. Investors who were there price a discount for that, and they are entitled to.
The cash question cuts both ways. If disclosure ever forces a split between shareholder cash and supplier float and the float is larger than assumed, the enterprise value rises and every multiple in this note gets worse. There is also no dividend, and management has said it wants flexibility for acquisitions, which introduces execution risk on top.
What would change the view
Four things would break it. A 1H27 TTV margin below 6.5% at the AGM or in November, because the entire thesis is margin expansion. A quantified Spanish tax liability above roughly A$50 million. WebBeds euro revenue growth landing below the 11% floor of Tuesday’s guidance, which would mean the operating business is weakening and currency was only ever the excuse. And a buyback that does not start in August or quietly slows: the board has told the market the price is wrong, and the buyback is the test of whether it meant it.
Investor takeaway
Web Travel Group shares are cheap on any reasonable treatment of the balance sheet, and the guidance issued on Tuesday is stronger than the reported Australian dollar figures make it look. That gap is the opportunity. It exists because the company reports in a currency it does not earn in, at a moment when the RBA is making that currency stronger.
What the market bought on Tuesday was the buyback, worth about 8% of the market capitalisation and gone once it is spent. What it should have bought was a third consecutive half of take-rate expansion in a business with 43.8% EBITDA margins and cash conversion above 100%. Base case A$3.80, roughly 21% above the current price, with the tax audit the reason to size it as a position rather than a conviction.